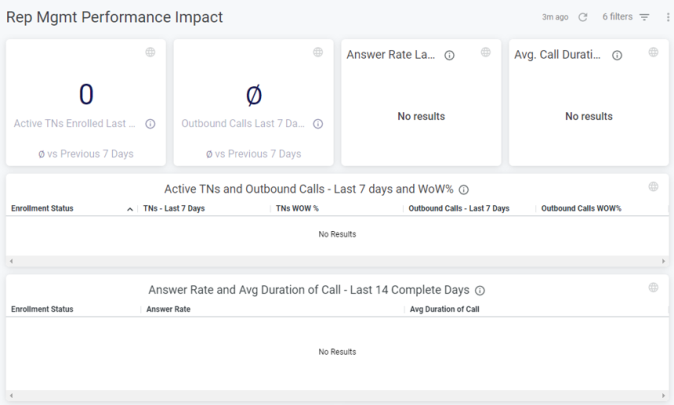
Understanding the Reputation Management Performance Impact Dashboard
The Insights Reputation Management Performance Impact dashboard combines call usage data for outbound calls through IntelePeer with reputation data. In this way, as a Reputation Management customer, you can see how your reputation scores affect traffic characteristics; for example, how does good or poor reputation affect call answer rate.
Note: This dashboard appears in the IntelePeer Customer Portal > Insights > Custom Analytics > Rep Mgmt Performance Impact once you purchase the product. For more details on using Insights, check out the Insights Quick Start Guide.
For more information, check out Understanding the Reputation Management Dashboard.
Common Issues
If you notice the calculations in the KPIs don’t align with your expectations, check out Common Dashboard Issues.
Dashboard Details
The following information can help you understand the different sections of the dashboard.
Using Filters
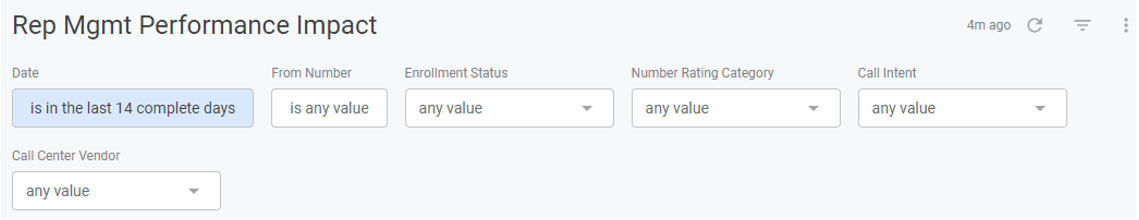
At the top of the dashboard, several filtering options are provided:
-
Date
-
From Number
-
Enrollment Status; statuses include:
-
Enrolled - Phone number has a reputation score other than Not Rated or NULL from all four data sources for that period. We submitted the numbers to the analytic platform for registration, the platforms completed processing those registration, and the platform has returned at least one week of reputation scores.
-
Enrollment in Progress - Phone number has Not Rated reputation score from all four data sources for that period. We submitted the numbers to the analytic platform for registration, and the platforms returned an indication in the last weekly scores that processing was in-progress.
-
Not Enrolled - Phone number either is absent or has a reputation score of NULL from all four data sources for that period. We didn't submit the numbers to the analytic platform; an edge case--we submitted the numbers but there hasn't been enough time for the platform to indicate the progress in the weekly data.
-
-
Number Rating Category; categories include:
-
Low/Medium - Phone number is Enrolled and does not have Spam or Fraud reputation scores from all four data sources. The calls with the number are unlikely to be tagged as spam or fraud.
-
Spam/Fraud - Phone number is Enrolled and has Spam or Fraud reputation scores from at least one data source. Calls with the number are at high risk of being tagged as spam or fraud.
-
None - Phone number is Not Enrolled or Enrollment in Progress.
-
-
Call Intent
-
Call Center Vendor
Note: For information on how to filter the data in the widgets, check out How to Filter Your Data.
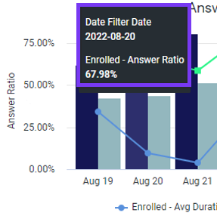
Navigating on the Page
To view specific data in the graphs, you can mouse-over a particular component, for example, one of the bars in a graph, to view a pop-up window showing component details.
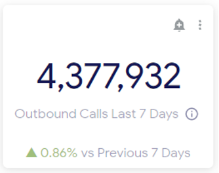
Setting Alerts
You can set alerts for any of the widgets on the dashboard. For example, mouse-over the Spam/Fraud Current Week widget. The Bell icon (Alerts) appears near the top of a widget. On the pop-up that appears, set the parameters, and the system sends email alerts when your thresholds are met.
For more details, check out How to Send Alerts for Single Widgets.
Using Widget Actions
Additional actions are available by mousing over the widget and clicking the vertical three dot icon. In the menu, you can:
-
Download the data used to calculate the totals in several formats.
-
Clear the cache and refresh the page so you get the most recent data.
Widget Titles
-
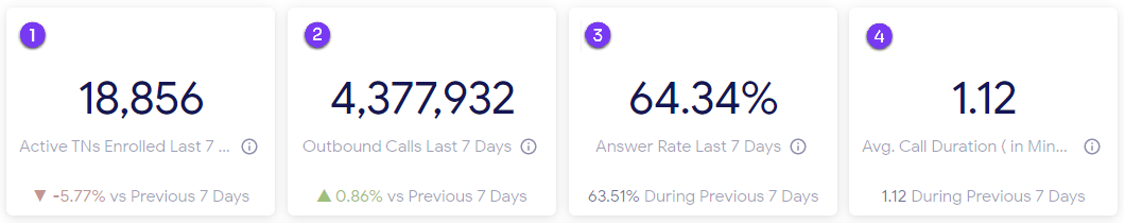
Active Telephone Numbers (TNs) Enrolled Last 7 Days – Distinct count of telephone numbers (TNs) with traffic that is enrolled based on the latest analytics platforms feed. Represents only TNs with outbound traffic. Doesn’t include Enrollment-in-Progress status. Doesn’t respond to Date and Enrollment Category filters .
-
Outbound Calls Last 7 Days – Aggregated value over last 7 days of completed outbound calls, representing Enrolled category, excluding Enrollment-in-Progress status. Doesn’t respond to Date and Enrollment category filters.:
-
Answer Rate Last 7 Days – Aggregated value over the last 7 days representing Enrolled category, excluding Enrollment-in-Progress status. Doesn’t respond to Date and Enrollment category filters.
-
Avg. Call Duration (in Min) Last 7 days – Aggregated average duration of all completed calls in minutes for the last 7 days, not counting today. Represents Enrolled category, excluding Enrollment-in-Progress status. Doesn’t respond to Date and Enrollment Category filters.
Note: Widgets marked as 1 – 4 represent only the Enrolled category and completed outbound calls.
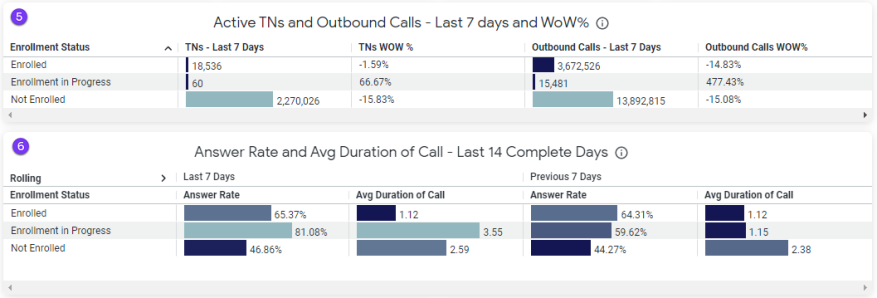
-
Active TNs and Outbound Calls – Last 7 Days and WoW% – Summarizes the KPI and week-over-week (WoW) change percentage, including Enrollment-in-Progress status, in a single view to facilitate comparison. Shows the metric aggregated for the last 7 days and changes from the previous 7 days’ aggregation by percentage. Doesn’t respond to Date filter.
Note: Week-over-week (WoW) is period comparison. Last 7 days – Previous 7 days. WoW% is the same represented as a percentage. WoW/Previous 7 days *100
-
Answer Rate and Avg Duration of Call – Last 14 Complete Days – Shows the metric aggregated for the last 7 days and changes from the previous 7 days’ aggregation by percentage. Doesn’t respond to Date filter.
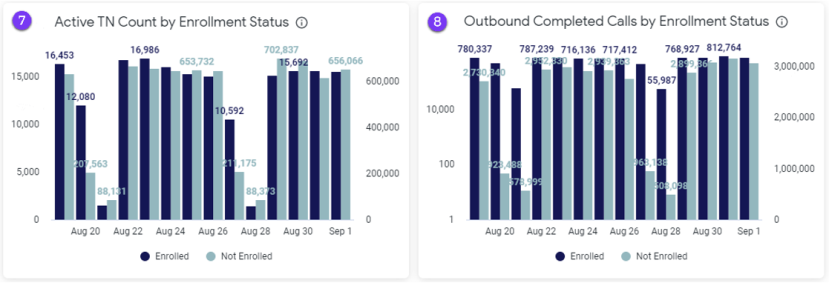
-
Active TN Count by Enrollment Status – Shows the breakdown between Enrolled and Not Enrolled statuses to help identify patterns and trends. Excludes TNs with Enrollment-in-Progress status. Doesn't respond to Enrollment Category and Number Rating filters.
-
Outbound Completed Calls by Enrollment Status – Shows the KPI breakdown between Enrolled and Not Enrolled statuses to help identify patterns and trends.
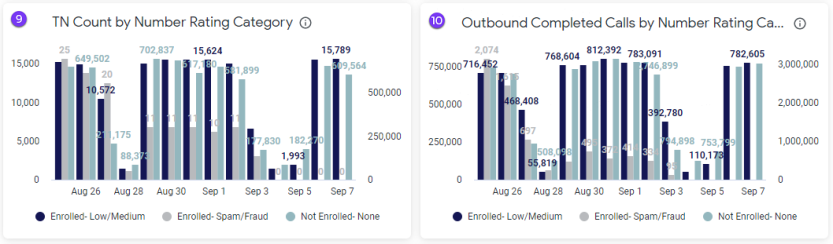
-
TN Count by Number Rating Category – Excludes TNs with Enrollment-in-Progress status. Doesn't respond to Enrollment Category and Number Rating filters.
-
Outbound Completed Calls by Number Rating Category – Shows outbound completed calls breakdown by Enrolled-Spam/Fraud, Enrolled – Low/Medium, and Not Enrolled-None number rating categories to help identify patterns and trends. Doesn’t include Enrollment-in-Progress status and doesn’t respond to Enrollment category and Number Rating filters.
-
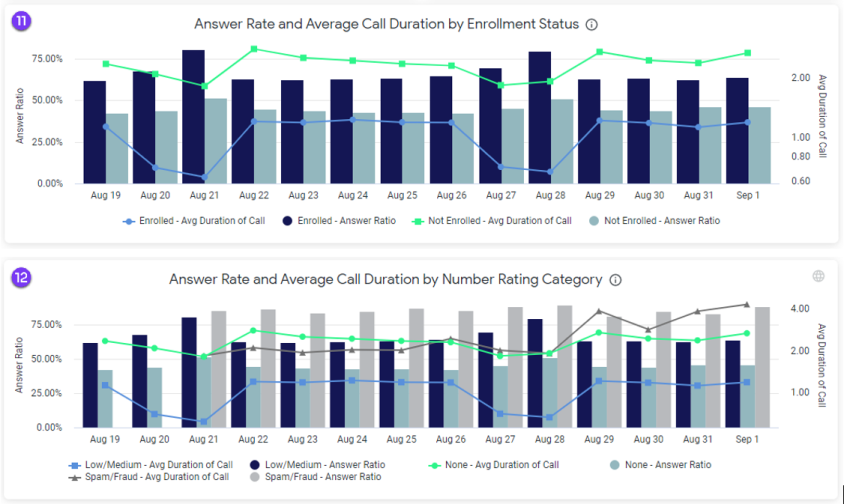
Answer Rate and Average Call Duration by Enrollment Status – Shows the average breakdown between Enrolled and Not Enrolled statuses to help to identify patterns and trends. Excludes TNs with Enrollment-in-Progress status. Doesn't respond to Enrollment Category and Number Rating filters.
-
Answer Rate and Average Call Duration by Number Rating Category – Shows the average breakdown among Enrolled-Spam/Fraud, Enrolled – Low/Medium, and Not Enrolled-None number rating categories to help identify patterns and trends. Excludes TNs with Enrollment-in-Progress status. Doesn't respond to Enrollment Category and Number Rating filters.
Note: All the trend charts can have a gap on certain days when there is no outbound call activity. This shouldn’t be mistaken for no reputation enrollment or rating.
For more information on terms used in this dashboard, check out the Insights Glossary.
Troubleshooting
-
If the dashboard widget shows like the following image, it means you don't have outbound traffic routing through IntelePeer: