Insights Quick Start Guide
This guide describes hot to navigate to and interact with dashboards within the Insights app. Learn more about:
Overview
Insights gives you the power to understand your Messaging, Voice, and SmartFlows data to help you improve business workflows, customer interactions, and omni-channel communication. In harmony with the Data API, aggregate or specific details are at your fingertips.
Note: For a list of available Insights product and procedure topics, on the IntelePeer Product Documentation site, click the tile for the Insights documentation section.
Getting Started
Log in to your IntelePeer account through the Customer Portal. Our recommended browsers are the current or most previous versions of Chrome, Firefox, or Safari.
Your applications appear at the top of the page. You can also clickMy Applications in the sidebar to access the Insights app.
![]()
Selecting a Dashboard
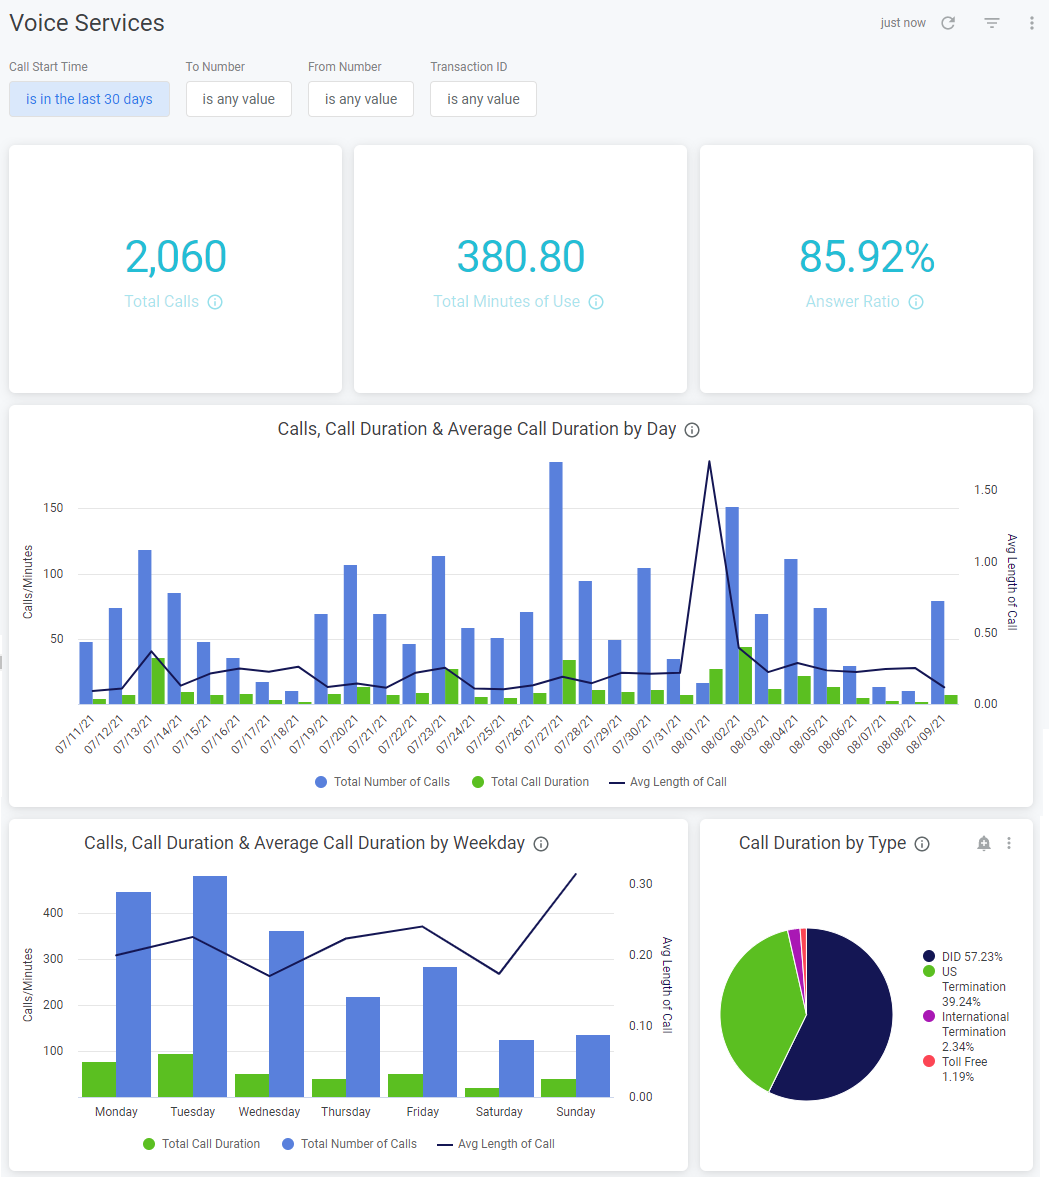
When you open Insights, a landing page displays the last seven days' usage totals and graphs for SmartFlows, Voice, and SMS based on your data.
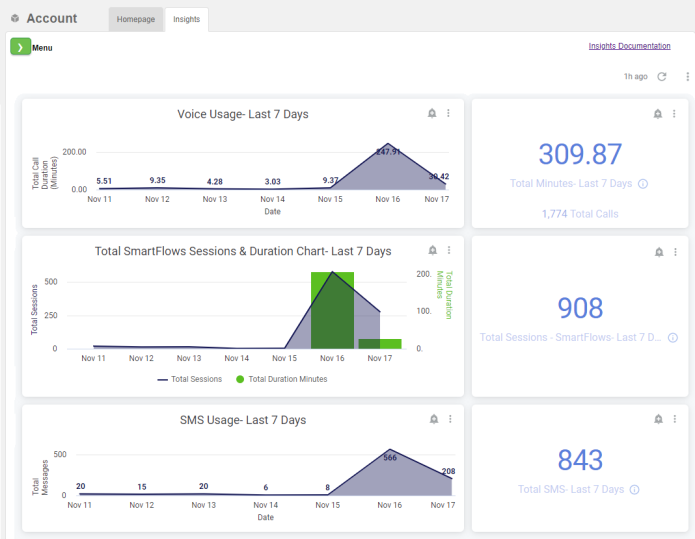
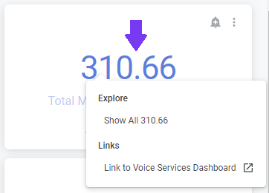
You can left-click any of the links on the page to view and download the supporting data behind the totals and charts, or go directly to the Voice Services, SmartFlows, or Messaging dashboard.
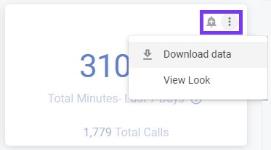
Click the Tile Actions (three vertical dots) icon to download the supporting data or view the widget separately. Click the bell icon to set up alerts. For more information, check out How to Send Alerts from Single Widgets.
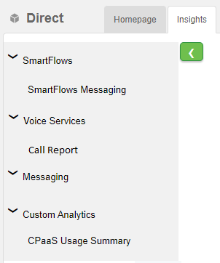
In the upper left corner of the page, click the Menu icon. A drop-down menu shows the dashboard and reports available to you. Select the dashboard or report you want to view and start exploring your data! If you have custom dashboard or reports, they appear in the Custom Analytics section.
Exploring Dashboards
To see underlying raw data, click the widgets. You can click KPI numbers, a bar of a chart, or sections of a pie graph. You can also download this data to various data formats. To learn more, check out How to Download Dashboard Data.
Filtering Dashboards
Filters apply to the dashboard based on what you choose. For voice and messaging, you can filter based on number, date, and transaction ID.
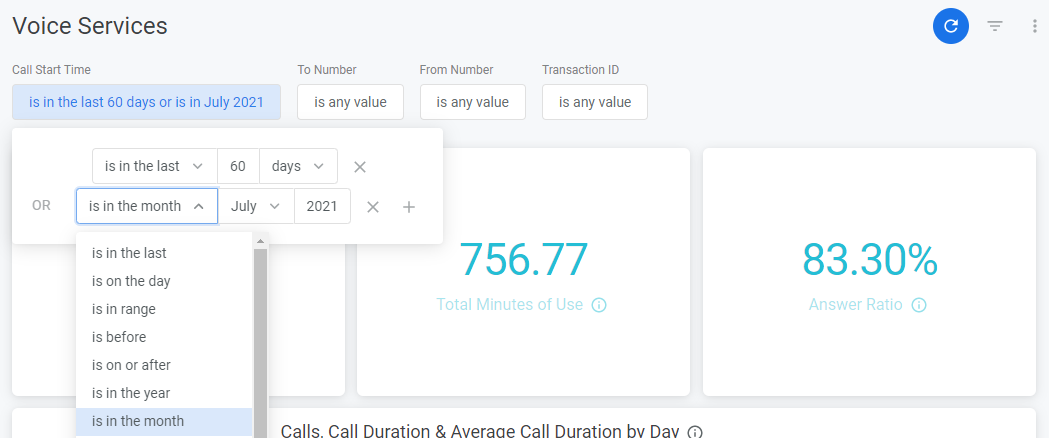
You can select a date range up to 60 days at a time. You can include additional filter settings (for example, values and transaction IDs), as well as click the Plus (+) icon to add filters within each filter type. Once you’ve entered your filters, click the Update icon at the top right of the page. The dashboard reloads using your desired filters. For more information, check out How to Filter Your Data.
Changing the Time Zone
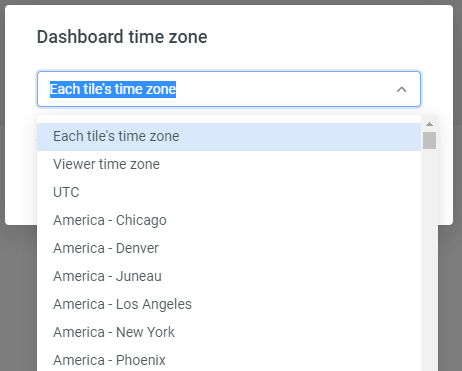
Near the top-right of the dashboard, click the Dashboard Actions (three dots) icon and click Each Tile's Time Zone. From the menu, select the time zone for the dashboard and click Update. The dashboard reloads with your selected time zone.
For more information take a look at the Insights Glossary.