Understanding the SmartFlows Inbound Call Automation Summary Dashboard
The SmartFlows Inbound Call Automation Summary dashboard makes it easy for you to see the value of IntelePeer communications automation, providing inbound voice traffic data for SmartFlows. You can also make changes to the KPIs to evaluate What-If scenarios based on changes to agent expenses and containment percentages .
The dashboard was designed for a specific purpose, so it's important to recognize its distinct objectives, focusing on what IntelePeer automation looks like for your company. It encompasses a broad overview of your platform and how automation affects it. This view offers personalized insights into agent utilization, cost projections, and potential savings that IntelePeer can bring to your organization. Flow designs and behavior, based on the unique qualities of your environment, may result in unexpected dashboard results.
Note: If you don't currently have this dashboard in your Custom Analytics folder (or you don't have a Custom Analytics folder) but are interested in adding it, contact your IntelePeer account representative.
Business Value
The value of this dashboard to your company comes from your ability to manipulate key elements to see how IntelePeer SmartFlows automation affects your bottom line:
-
Understand what percentage of your total minutes are handled by SmartFlows automation. Evaluate the performance of automation over different time periods and how that changes the KPIs by identifying how much agent time is used.
-
Eliminate the influence of short duration calls.
-
Focus on a specific flow name to see how changes affect total dollars saved: higher vs. lower levels of automation.
-
View the changes caused by increases or decreases in agent costs and percentage of SmartFlows automation use.
Work with your IntelePeer support personnel to determine how increased automation can help your bottom line.
Dashboard Details
The following can help you understand the different sections of the dashboard.
Definitions
Inbound calls are considered contained if they are not transferred out of IntelePeer SmartFlows for the entirety of the call; for example, a customer’s call is not sent to an actual agent and was completely handled through automated SmartFlows actions. Live agent time occurs outside of SmartFlows and may include human interaction with a call or some other non-IntelePeer system activity.
All inbound calls are measured in minutes from the time they enter the IntelePeer environment to when the calls are ended.
Accessing the Dashboard
To view your dashboard:
-
Log into the Customer Portal.
-
On the Home page, click the Insights icon > Menu > Custom Analytics.
Note: If you don't currently have this dashboard in your Custom Analytics folder (or you don't have a Custom Analytics folder) but are interested in adding it, contact your IntelePeer account representative.
Common Issues
If you notice the calculations in the KPIs don’t align with your expectations, check out Common Dashboard Issues.
Using Filters and What-If Fields
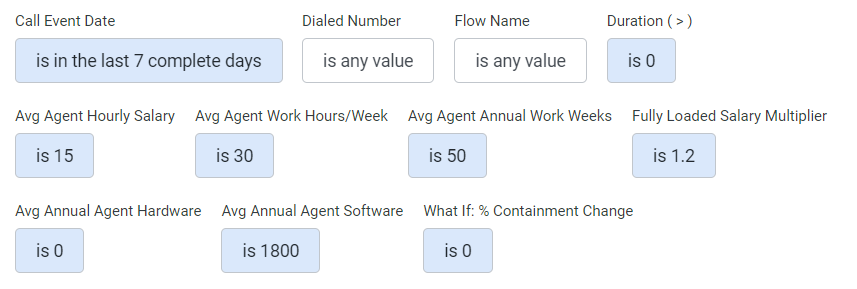
At the top of the dashboard, the following filtering options are provided:
-
Call Event Date - For more information, check out How to Filter Your Data
-
Dialed Number – Limit the evaluation to a single phone number (Optional)
-
Flow Name - Generic name automatically assigned to your flow (for example, Flow_209765), but can be edited to include helpful descriptors, for example, HR Virtual Assistant (Optional)
-
Duration (>) – Includes and displays calls that are greater than the value in seconds entered in the filter; for more information on how to use this filter, check out the Using the Duration Filter section
-
Avg Agent Hourly Salary – Default is set to 15 hours; this calculates approximately to $40K per year
-
Avg Agent Work Hours/Week – Default is set to 30 hours
-
Avg Agent Annual Work Weeks – Default is set to 50 weeks
-
Fully Loaded Salary Multiplier – Default is set to 1.2, adjust to reflect benefits and other additions associated with agent pay
-
Avg Annual Agent Hardware – Default is 0 dollars
-
Avg Annual Agent Software – Default is 1800 dollars
-
What If: % Containment Change – Represents the percentage of activity attributed to fully contained call activity; default is 0 percent.
Note: When entering percentage values for this filter, use whole numbers. For example, for 20 percent, enter 20 instead of 0.2.
Use this filter to see how much your ROI will go up or down by percentages. For example, if your Total $ Value Saved KPI shows $1,000 saved, you can change the filter percentage to 20, and the $1,000 increases to $1,200.
Note: All $ Saved KPIs are calculated based on assumptions around call center agent costs and working time. Defaults for calculations can be changed to fit your business. Check out Total $ Value Saved for more information.
For information on filtering, check out How to Filter Your Data.
Using the Duration Filter
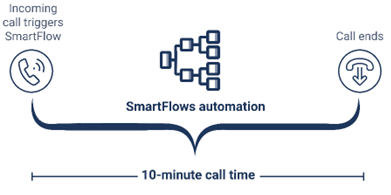
This filter applies to the full call length only, from start to hang-up. A SmartFlow session (all actions of the flow) may extend beyond the end of the call—for example, once the call is over, you may want to access a company database or run an API call—but is not included in the call time calculation.
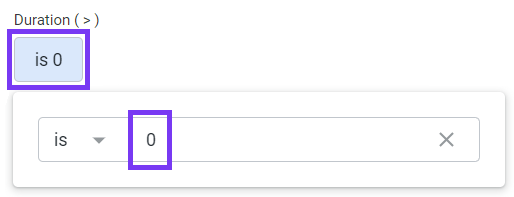
Note: The filter defaults to an operator of Is and an option of 0 seconds.
To use the filter:
-
Under the Duration filter heading, click the field. The operator and option pop-up appears.
-
In the option field, highlight the number and type a number in its place. All calls with a duration greater than the number you type are included in the calculation. All numbers less than and equal to the number duration are not included. In the image, 0 is in the option portion, representing 0 seconds. This means all calls would be included in the calculations.
Note: As an example, if you type 30 in the option field, all calls greater than 30 seconds in duration are included in the calculations. All calls with a duration of less than and equal to 30 seconds are not considered.
-
Once you make a selection, in the upper right corner, the Update button appears. Click Update.
Note: The KPIs change to reflect the calls included in the calculations.
Using Widget Actions
The dashboard is comprised of several widgets. A widget is an object in the viewing area that displays a chart, KPI, or table. Following are examples from the dashboard with numbers associated to each visualization with a corresponding description.
For more information on terms used in this dashboard, check out the Insights Glossary.
KPIs
-
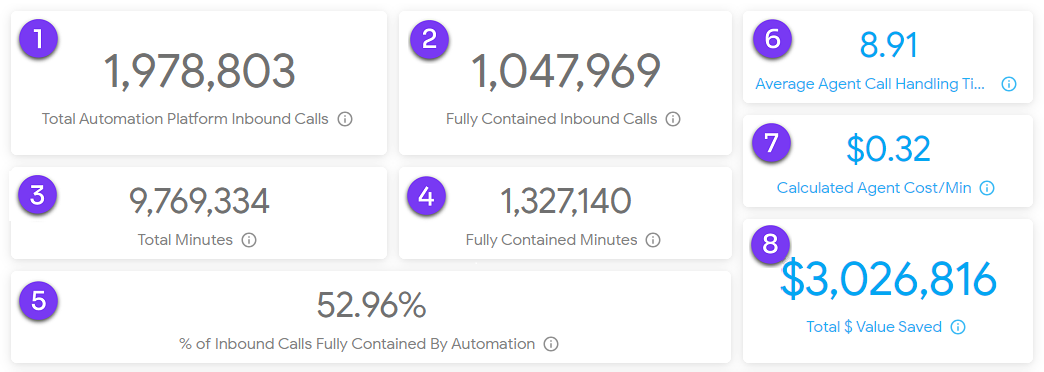
Total Automation Platform Inbound Calls - Sum of all inbound calls handled by SmartFlows without live agent intervention
-
Fully Contained Inbound Calls - All inbound calls handled by SmartFlows and completed without a transfer outside of SmartFlows
-
Total Minutes - Sum of the duration of all inbound calls handled by SmartFlows and a live agent
-
Fully Contained Minutes - Duration in minutes of all calls handled by SmartFlows and completed without a transfer outside of SmartFlows
-
% of Inbound Calls Fully Contained by Automation - Percentage of calls fully handled by automation: [Fully Contained Inbound Calls] / [Total Automation Platform Inbound Calls]
-
Average Agent Call Handling Time - The average length of a call for all customer calls that are transferred off the platform, from the start of the transfer until the end of the call.
-
Calculated Agent Cost/Min - Calculation based on dashboard inputs representing the cost of a contact center agent on a per minute basis: [Hourly Agent Annual Salary] + [Annual Software Cost] + [Annual Hardware Cost] / [Number of Minutes Hourly Employed] * [Fully Loaded Benefits]
-
Total $ Value Saved - Total amount of agent time saved as a dollar value based on the calculated agent cost/minute: [Calculated Agent Cost/Minute] * [Average Call Handling Time] * [Fully Contained Calls]. Average Call Handling Time (ACHT) is the average length of a call for all customer calls that are transferred off of SmartFlows
Charts
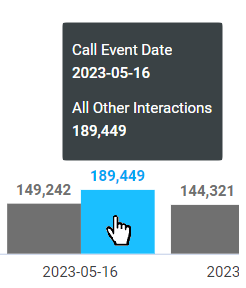
Note: Hover over any chart elements to provide a pop-up displaying the details.
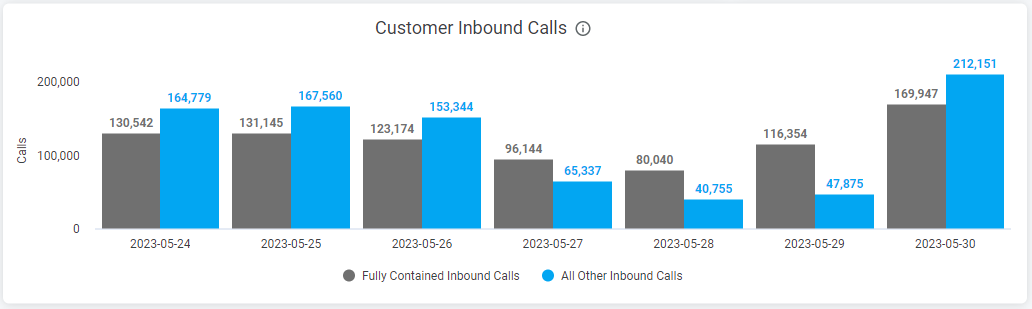
Customer Inbound Calls
-
Fully Contained Inbound Calls – Sum of inbound calls fully contained by SmartFlows
-
All Other Inbound Calls – Sum of inbound calls partially contained by SmartFlows
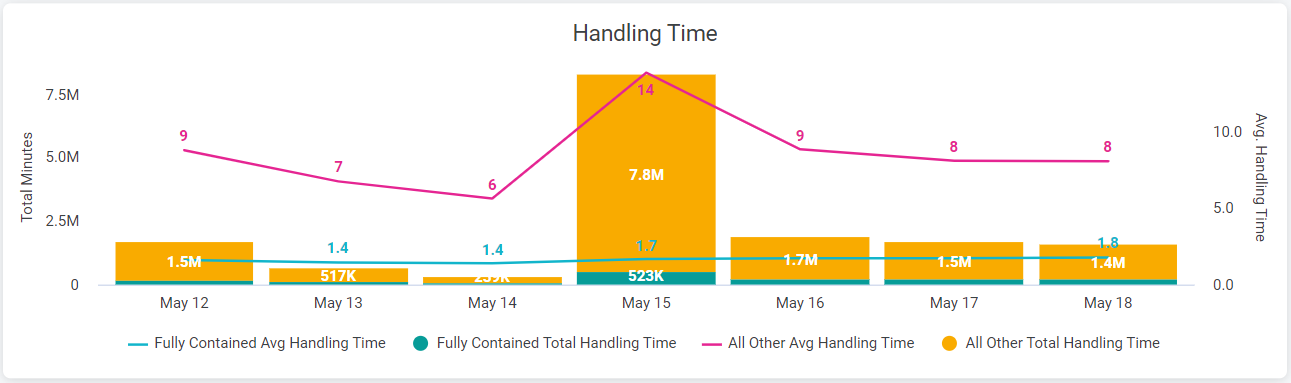
Handling Time
-
Fully Contained Avg Handling Time - Average of call duration for calls associated with SmartFlows where there was no transfer action
-
Fully Contained Total Handling Time - Sum of inbound call duration for calls associated with SmartFlows that ended on the IntelePeer platform without a transfer action
-
All Other Avg Handling Time - Average call handling time for calls that were partially contained (for example, a transfer action occurred)
-
All Other Total Handling Time - Sum of the partially-contained minutes