Understanding the SmartQueuing Dashboard
Contact center operations is concerned with managing the demand (call volume) and supply (agents). Any imbalance has a business impact.
-
High demand and low supply results in low cost to serve and a poor customer experience
-
Low demand and high supply results in high cost to serve and a better customer experience
Once you become a SmartQueuing customer, the Insights SmartQueuing dashboard is available for your use. The dashboard helps your contact center managers and supervisors monitor call queue activity and performance. The dashboard provides visibility into your call queue metrics and trends. By using this information, you can achieve the following outcomes:
-
When calls exceed the threshold in a call group, the supervisor can either leverage agents from other underutilized call groups or make a case for hiring more agents if it's a recurring issue.
-
Evaluate KPIs and understand any pattern changes.
Note: Because the underlying table data for this report is not ADR data, you won't be able to pull the data using the ADR API.
For more information, check out the SmartQueuing topic.
Data Refresh and Availability
The dashboard is updated every 15 minutes and shows two (2) years of history.
Common Issues
If you notice the calculations in the KPIs don’t align with your expectations, check out Common Dashboard Issues.
Using Filters

At the top of the dashboard, several filtering options are provided:
-
Date
-
Call Group Name; when you click the field, from the menu, you can select one or more call groups to analyze
-
From Number
-
Dialed Number
-
Transfer Call Duration (Minutes)
-
Queued Call Duration (Minutes)
Note: For information on how to filter the data in the widgets, check out How to Filter Your Data.
Navigating to the Dashboard
-
From the Customer Portal Home page, click the SmartQueuing tile, and then click View Dashboard.
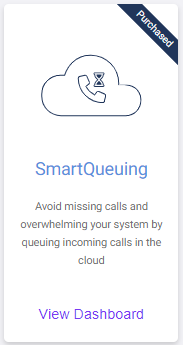
The SmartQueuing dashboard provides a view of your call groups arranged in individual tiles.
-
Click View Dashboard Report. The report provides filters, KPIs, and charts. For more details, check out the Widget Titles section.
Use the filters on the dashboard to:
-
View data for a specific Call Group or several tiles: View the report, and then use the Call Group Name filter to limit the data to a specific call group or groups.
-
Directly access Insights for all call groups: Leave the Call Group Name filter blank; data for all call groups are displayed.
Setting Alerts
You can set alerts for any of the widgets on the dashboard. For example, mouse over the Average Call Volume widget. The Bell icon (Alerts) appears near the top of a widget. On the pop-up that appears, set the parameters, and the system sends email alerts when your thresholds are met.
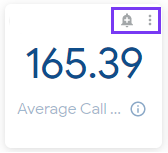
Note: For more details, check out How to Send Alerts for Single Widgets.
Using Widget Actions
Additional actions are available by mousing over the widget and clicking the vertical three dot icon. In the menu, you can:
-
Download the data used to calculate the totals in several formats.
-
Clear the cache and refresh the page so you get the most recent data.
Note: All visuals cross-filter each other. You can interact with the dashboard’s data and understand how one metric affects another by clicking a datapoint in one widget or a row in a table to have all other widgets automatically filter on that value.
Widget Titles
-
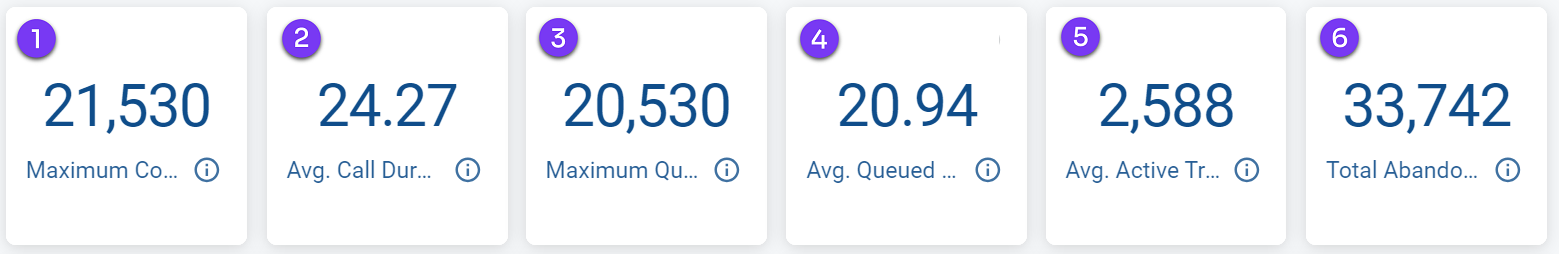
Maximum Concurrent Calls – Maximum incoming concurrent calls during the selected period. Includes both queued + transferred calls
-
Average Call Duration (Minutes) - Average duration in minutes of talk time for all answered calls by agents that were previously in queue
-
Maximum Queued Calls – Maximum number of calls currently waiting to be served in the queue during the selected period
-
Average Queued Call Duration (Minutes) - Average waiting time in minutes of all queued calls during the selected period
-
Average Active Transferred Calls – Average number of calls currently handled by the agents during the selected period
-
Total Abandoned Calls - Total number of queued calls abandoned by callers before answered by agents during the selected period
-
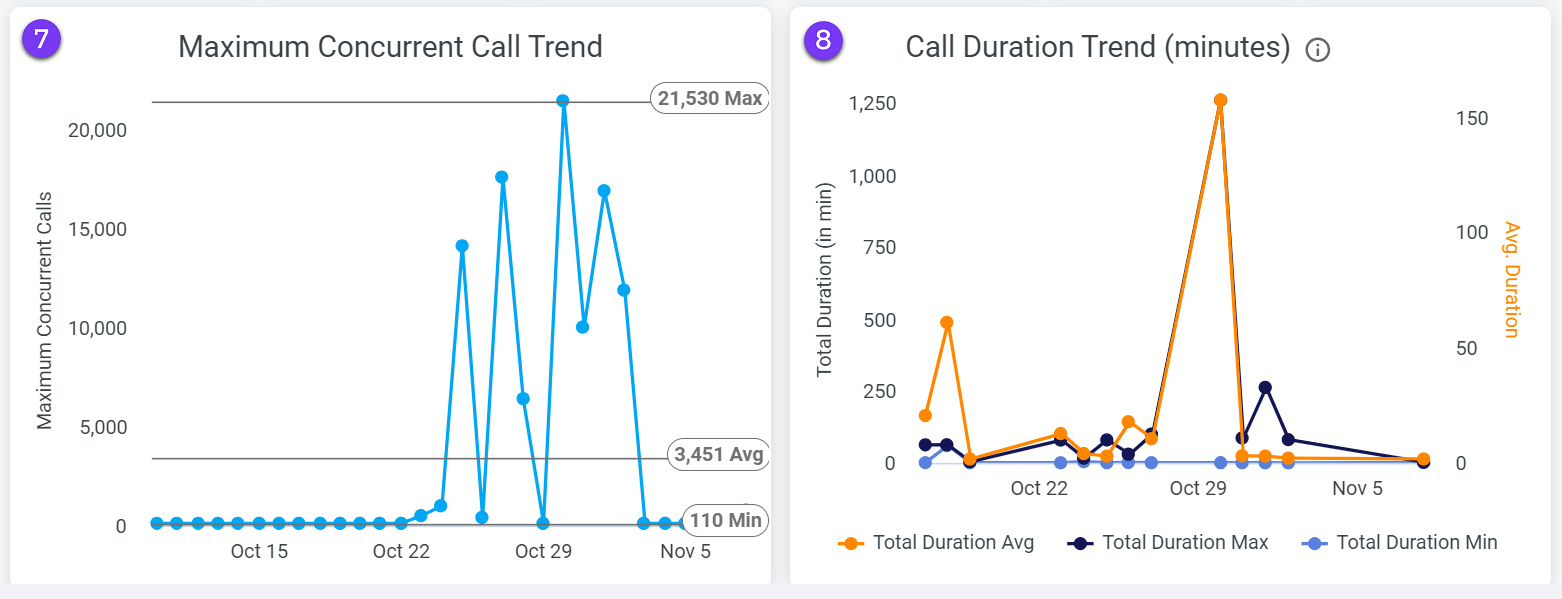
Maximum Concurrent Call Trend - Maximum number of concurrent calls during the selected time period including queue and transfer
-
Call Duration Trend (Minutes) - Total duration of queue waiting time and talk time for all answered calls by agents that were previously in queue
-
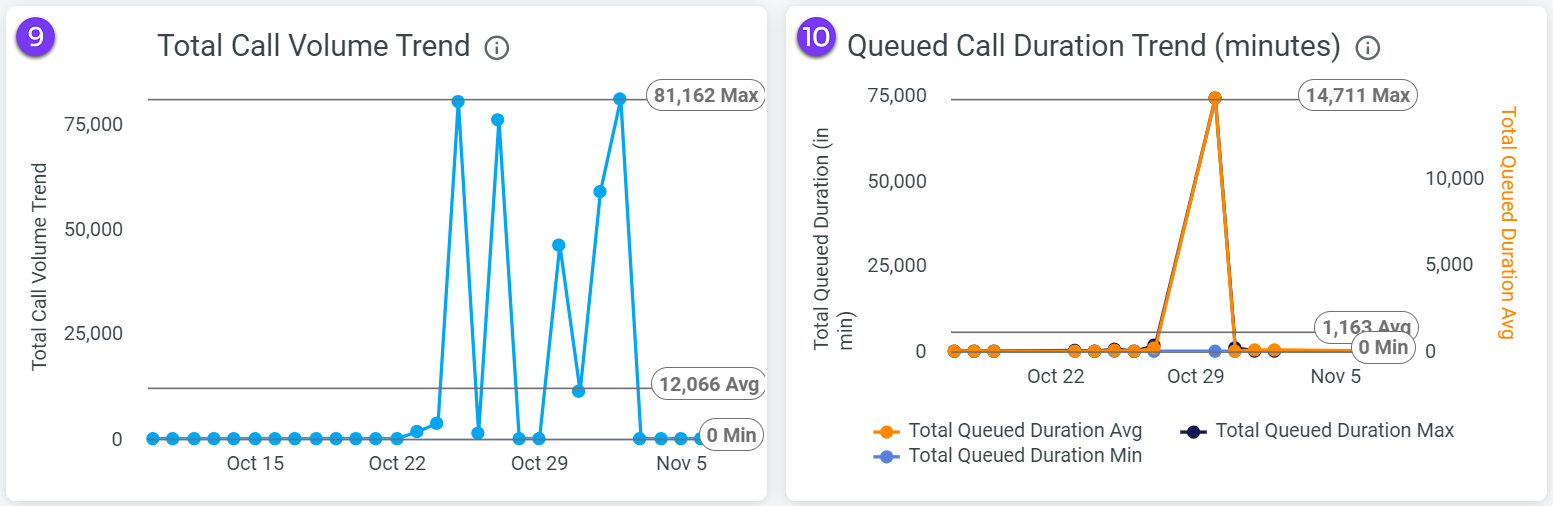
Total Call Volume Trend - Total call volume trend during the selected time period including queue and transfer
-
Queued Call Duration Trend (Minutes) - Total waiting time of all queued calls during the selected period
-
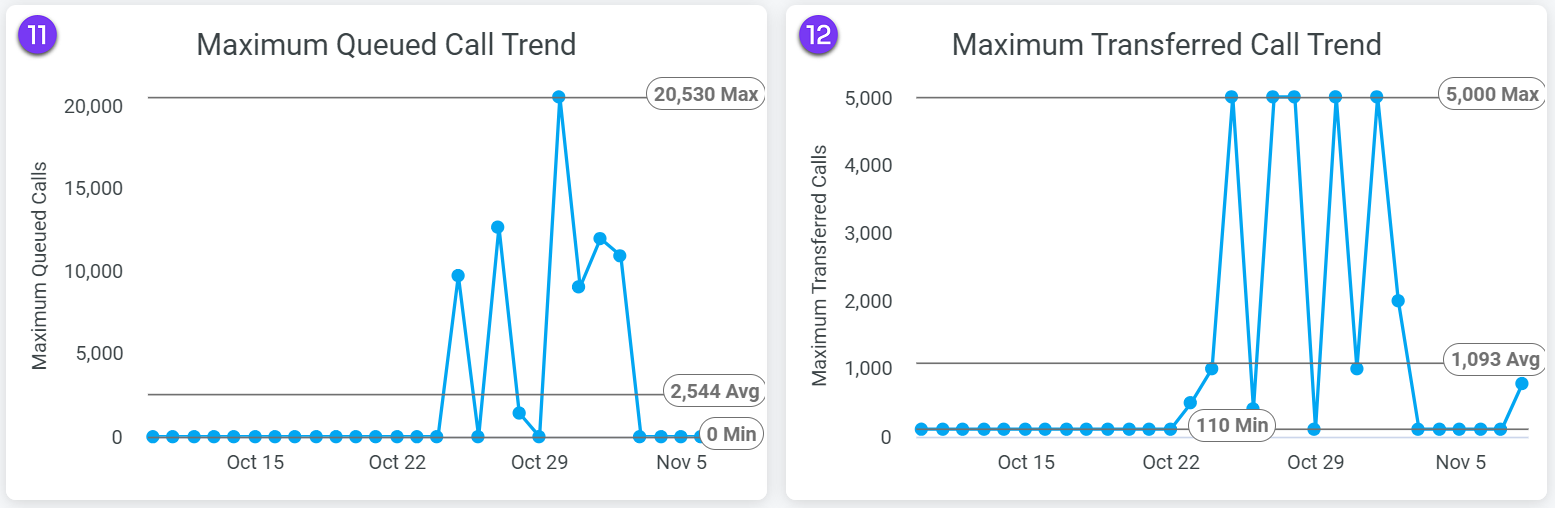
Maximum Queued Call Trend - Maximum number of callers in queue waiting to be served on a given day
-
Maximum Transferred Call Trend - Maximum number of callers transferred to the call center on a given day
-
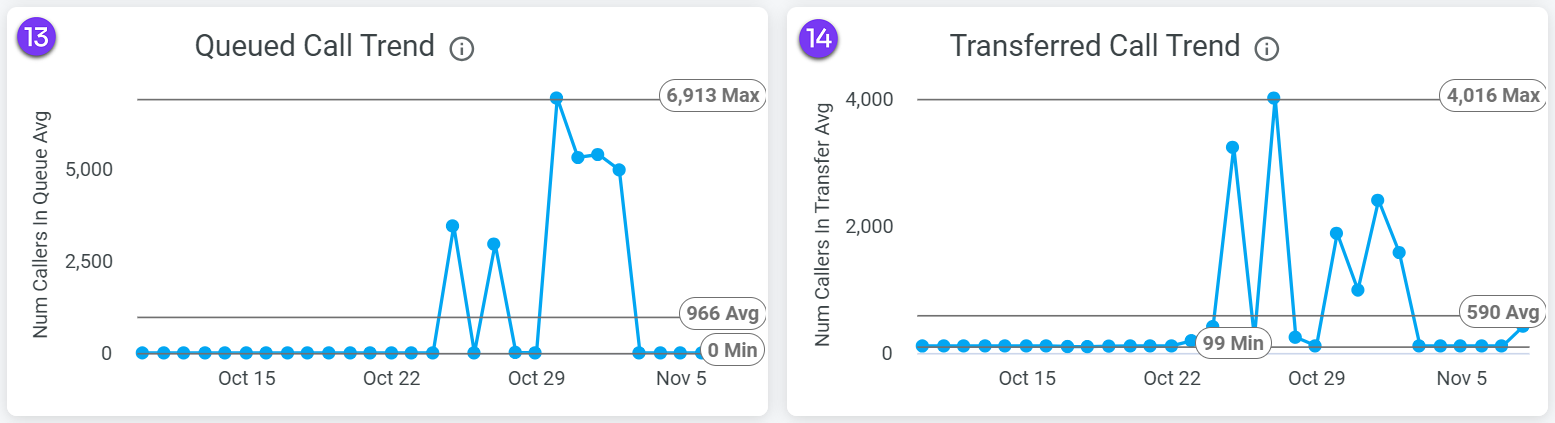
Queued Call Trend - Number of calls currently waiting to be served in the queue during the selected time period
-
Transferred Call Trend - Number of calls currently handled by the agents during the selected time period
-
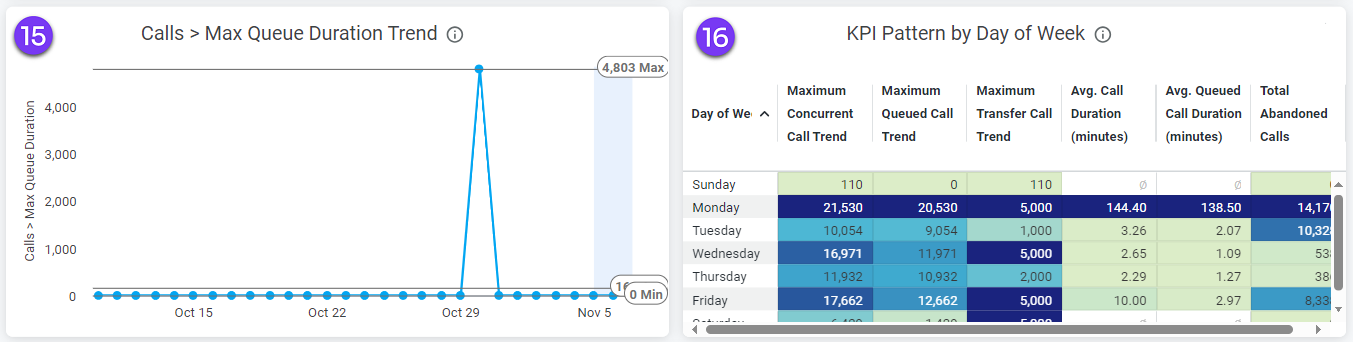
Calls > Max Queued Duration Trend - Total number of queued calls that exceeds maximum allowable queue time
-
KPI Pattern by Day of Week – Review to discover any patterns in call traffic and the associated KPIs by day of week
-
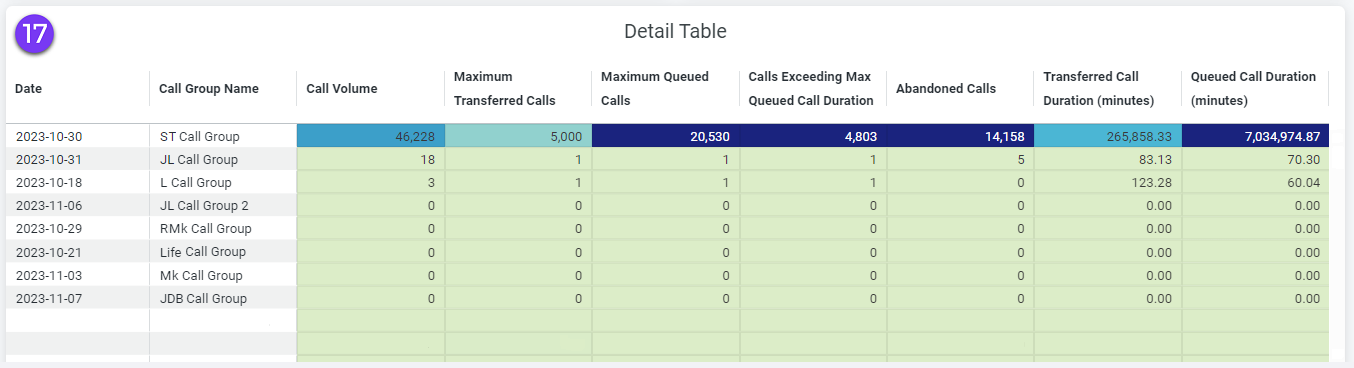
Detail Table - Provides an at-a-glance perspective on each call group